Does density bring better public transportation, or does better public transportation bring density? This is the question I’m grappling with after beginning a series of posts reflecting on my family’s winter holiday – a tour of the capital cities of the Nordic nations at the heart of winter.
I first noticed how our modes of transportation were so different from our life in Edmonton, a city on the Canadian Prairies. The city planner in me needs to explore what is structurally, there and here. When I explored the population density of the cities we explored, I found that most Nordic cities were far more dense than the large cities on the Canadian Prairies (Calgary, Edmonton and Winnipeg). For example, Copenhagen is six times more dense than Edmonton.
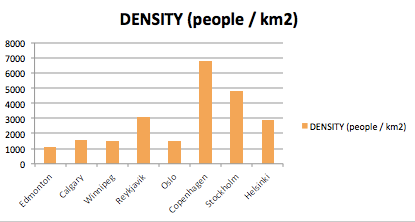
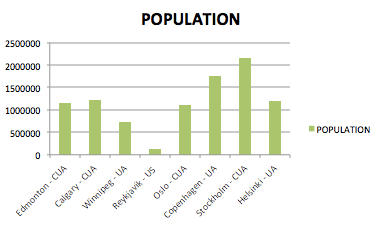
In my last post, Nordic density, I noted the physical differences of these densities. In this post, I take a look at public transportation, but before I do, let’s take a quick look at the population density of the urban area for each of these city-regions. (I’m using Thomas Brinkoff”s calculations based on the agglomeration of an urban area – a central city and the neighbouring communities linked to it by continuous built up areas or commuters.) This is an vital way to look at density without the inaccuracies of vast tracts of land that are undeveloped in some municipalities, and not others.
The numbers below reflect the density of the actual built-up area, regardless of the location of the municipal boundary. This is the number that most reveals what’s happening on the ground.
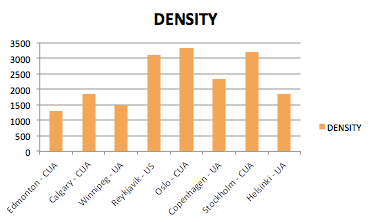
On the ground, Reykjavik, Oslo and Stockholm are the most dense cities. Edmonton and Winnipeg are the least dense. The reason why they are less dense is the large area of developed land, with low population. The bar charts below are using numbers relating to the built area – not the municipal boundaries.

Some Public Transportation Numbers
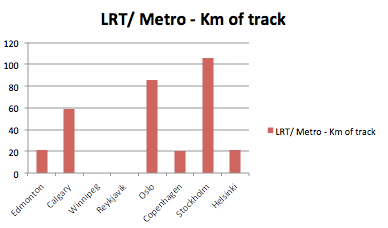
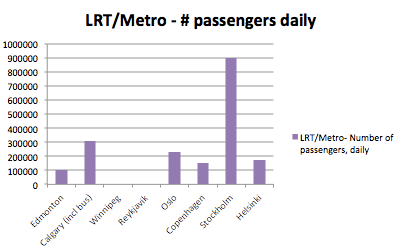
Not all of these cities provide LRT or Metro/Subway transportation to residents (Winnipeg and Reykjavik do not). The first to start was Oslo in 1898. Stockholm was next in 1950 (with “pre-metro) service in 1930. Edmonton, Calgary and Helsinki completed LRT / Metro service between 1978 and 1982. Copenhagen added its Metro line in 2002.
Stockholm has the most kilometres of track at 105.7km, followed by Oslo at 86km.
Stockholm also moves the most passengers per day, at 898,630 by rail.
To compliment LRT/Metro service, Oslo, Stockholm and Helsinki also provide tram/trolley options for movement in the city. Oslo and Helsinki accommodate an additional 132,000 and 200,000 riders daily. (I am unable to locate ridership for Stockholm.)
Edmonton had 90 km of tram service from 1908 to 1951, and 127km of trolleybus service from 1938 to 2009. Calgary had trolleybus service from 1947-1975 and is looking at its streetcar history for future transit. Winnipeg had 193km of streetcar service from 1918 to 1955. These services have been replaced by bus.
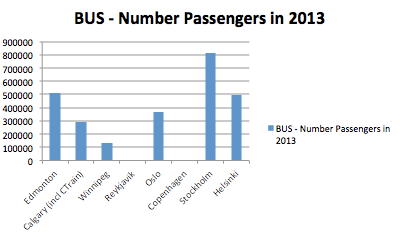
Stockholm moves a great number of people by bus, as do Edmonton and Helsinki. I am unable to find bus ridership numbers for Reykjavik and Copenhagen, but it is clear that ridership for Stockholm is again high, at 814,000 passengers, in addition to high numbers of passengers my Metro, and tram/streetcar. Edmonton and Helsinki have higher numbers of passengers moving by bus than LRT/Metro.
The Mesh and the Linear Patterns
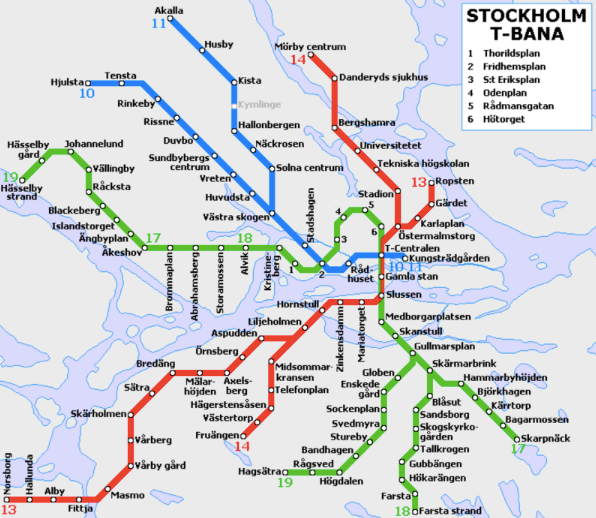
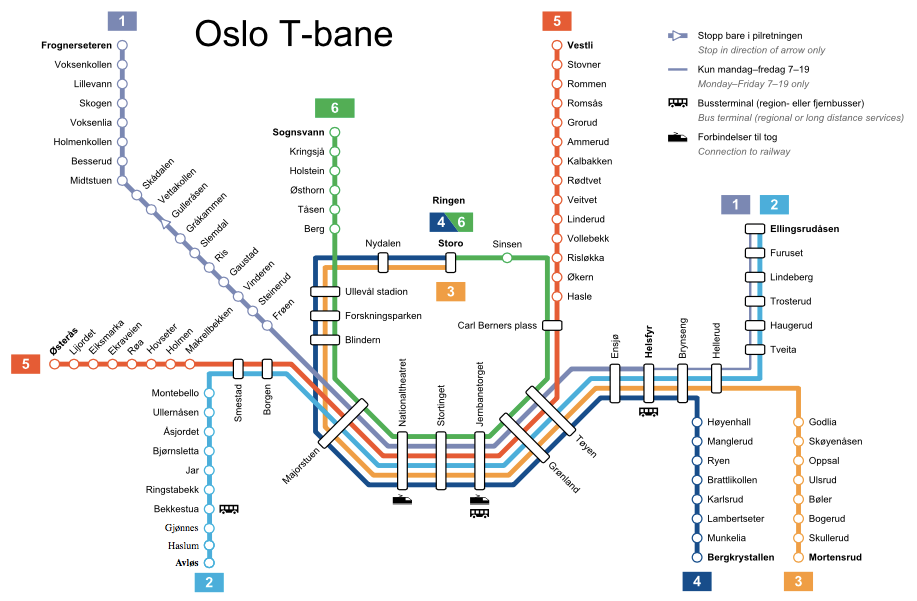
Stockholm is both the most densely populated city and the city with the largest investment in track and the largest ridership. Oslo also has a significant investment in the T-bane.
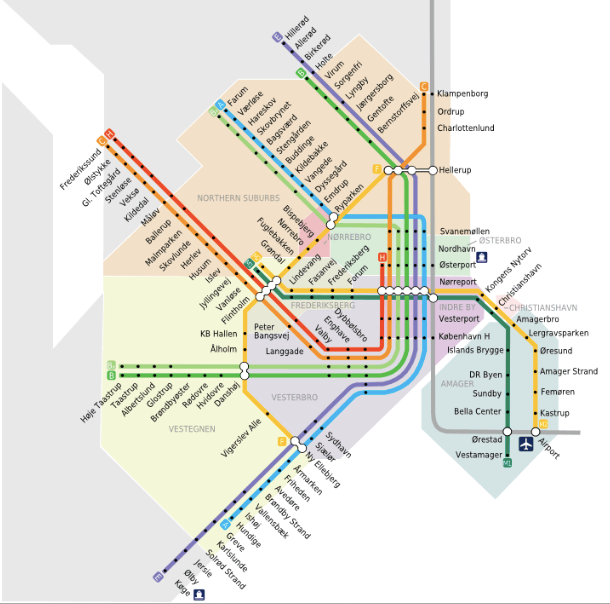
Copenhagen has the most the recent rail system, first complete in 2002, and they are now constructing The City Circle line (not shown), which will add an additional 15.5km of track to the 20.4km system. The current system below, is 20.4 km.
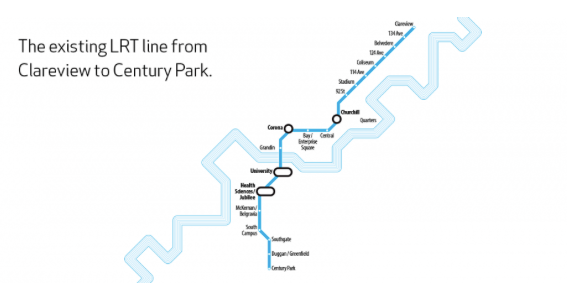
In contrast, Edmonton’s 21 km of track, barely more than Copenhagen’s track, serves the city in a radically different way. Instead of serving the population at the core (remember there are many more people in the core of Copenhagen), the Edmonton system serves the population along a length of track.
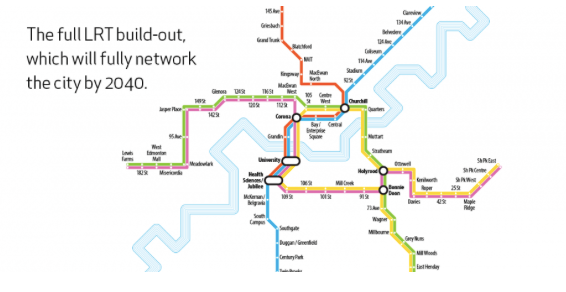
Even with the planned construction out to 2040, Edmonton continues to serve a sparse population with a sparse LRT.
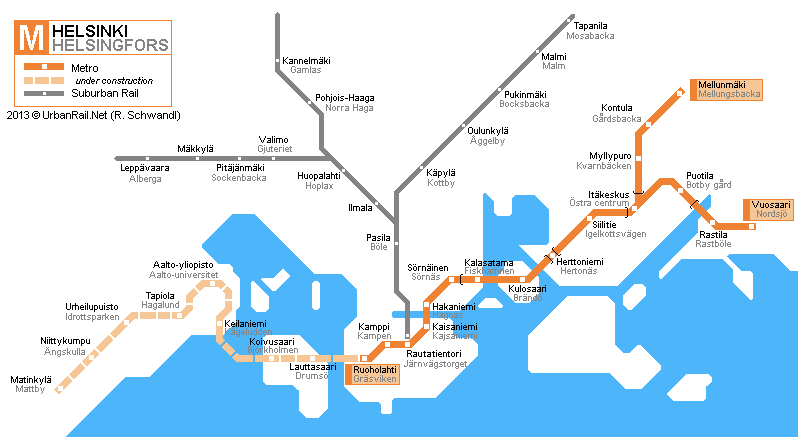
Helsinki has 21.1 km of track. It, too, stretches in linear fashion through the city.
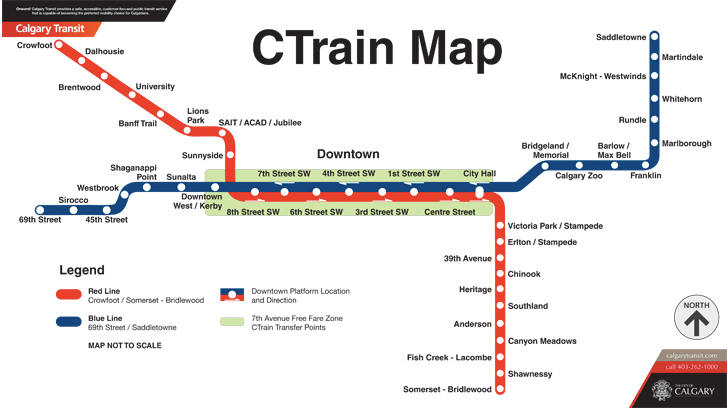
Calgary’s CTrain, at 60 km, is still fairly linear in nature.
There are two patterns at work here, and they are connected to density. The mesh of Copenhagen, Oslo and Stockholm appear with higher population density. The linear pattern of Edmonton appears with low, sparse population.
Does density bring better public transportation, or does better public transportation bring density?
_____
If you are interested in exploring the ground I’ve covered in reflecting on our visit to these winter cities in winter, here’s the thread of these Nordic posts:
- We chose to stay in nifty Nordic neighbourhoods
- Our Nordic modes of transportation were different than in Edmonton
- Nordic density is different from density in cities on the Canadian Prairies
_____
Sources:
Population, area and density:
- Thomas Brinkhoff: City Population, http://www.citypopulation.de
Transportation:
- http://www.edmonton.ca/transportation/ets/about_ets/ets-statistics.aspx
- http://www.edmonton.ca/transportation/2013_LRT_Passenger_Count_Report.pdf
- https://www.calgarytransit.com/about-us/facts-and-figures/statistics
- http://www.apta.com/resources/statistics/Documents/Ridership/2014-q1-ridership-APTA.pdf
- http://www.lta.gov.sg/ltaacademy/doc/13Sep105-Pan_KeyTransportStatistics.pdf
- https://www.hsl.fi/sites/default/files/uploads/hsl_moves_us_all_1.pdf
- http://en.wikipedia.org/wiki/